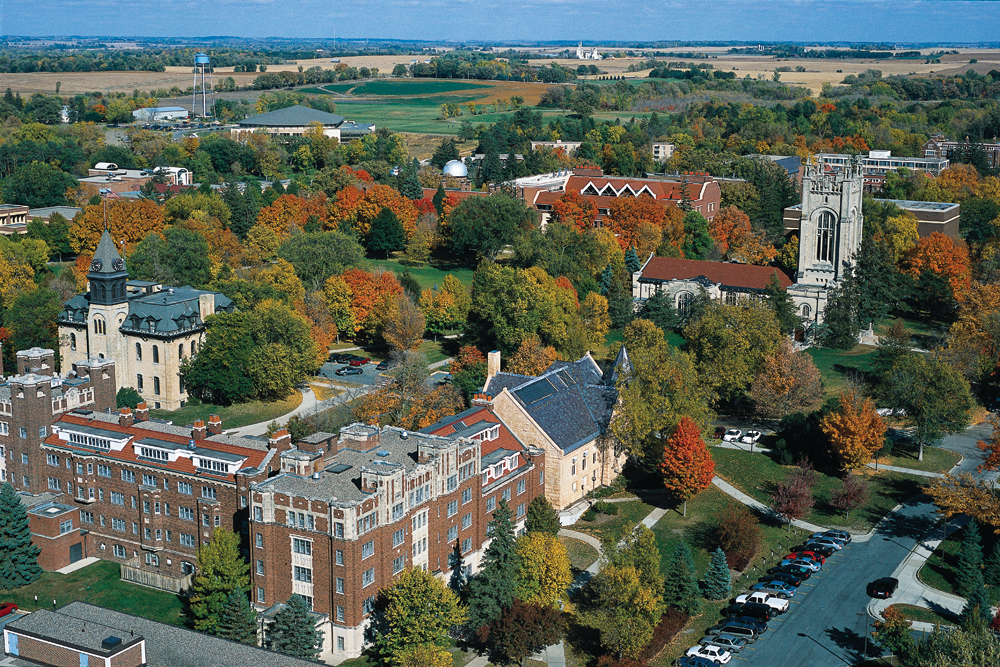
Data Analysis on World University Rank
This project was the final project for my Intro to Data Science class. We utilized the Shiny package in R to develop a website that incorporates data manipulation, visual representation, and machine learning methods to analyze World University Rankings from three distinct sources.
Statistical Consulting: Data analysis and visualization for Age-Friendly Northfield
This was a statistical consulting project I worked on for a real-world client – Age-Friendly Northfield. We cleaned survey data, looked for possible service gaps, and conducted analysis on different categories of in-home services and supports for the older population using R.
Learning and Teaching Center Teaching Workshop Attendance Analysis
This was one of the data analysis projects that I worked on for my campus job at DataSquad. I cleaned and organized messy data using Open Refine and performed data analysis and visualization using R. I then presented the findings to the LTC committee in the form of a presentation. Due to the confidential nature of the data, only one of the plots is being shared without any identifying information.
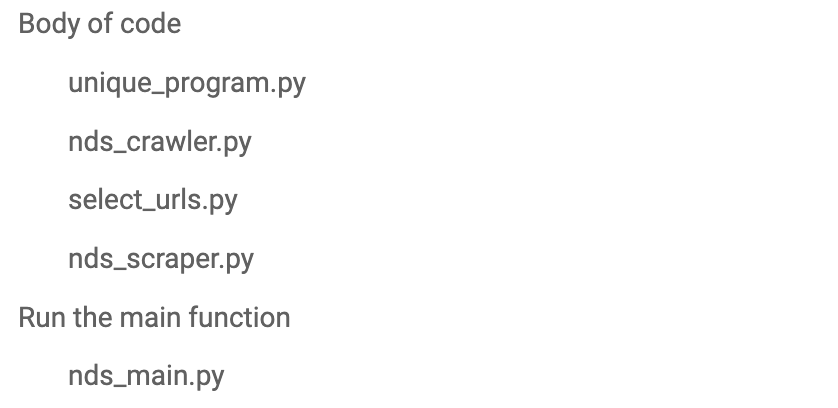
News transcript scraping projects
I edited and debugged a scraping project that scrapes the broadcast news transcripts from the NDS website for a political science research project. We scraped over 2000 queries and almost 30,000 news transcripts. This program is written with Selenium, pandas, as well as some other python packages.
Final Paper for Regression analysis
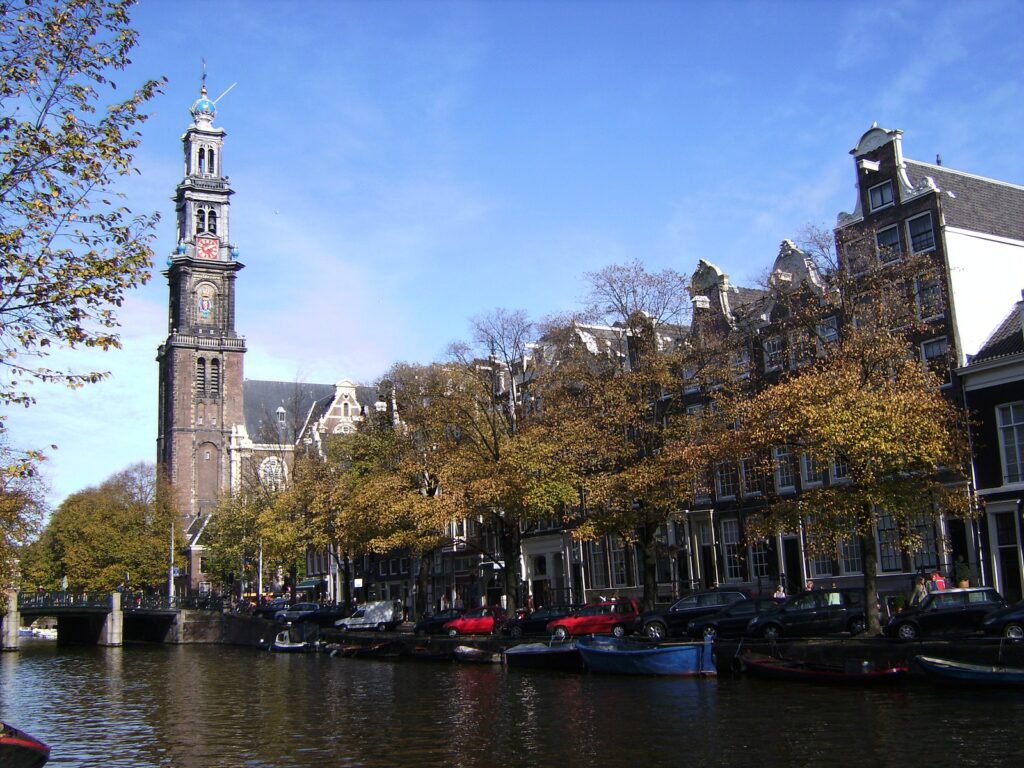
This paper analyzes the key factors that influence the prices of Amsterdam Airbnb. We fitted a multiple regression model and adjusted the included variables accordingly to make sure each variable is significant.
